Sachin M M


A Data Geek from Engineering background.
Specializing in Data Visualization, BI & Analytics.


🟢

Resume 📥 Projects 🔗

About Me 🙋‍♂️

Power BI & Analytics Expert

Hi, I'm Sachin, a math wizard turned as Analytics Engineer with 4 years of experience in various domain.

As a BI & Analytics Engineer with a strong background in engineering and math. I'm skilled in data modeling, data analysis and visualization, using tools like Power BI, Power Query, Power Automate, Data Modelling, ETL, SQL, Python and Azure.

Motivated professional eager to take on new challenges, embrace ownership, and leadership responsibilities. I aim to leverage my diverse skills to help the organization achieve impactful results.

Technical Skills 💡

Primary Skills 🟢 | Secondary Skills 🟡


Description of the SVG

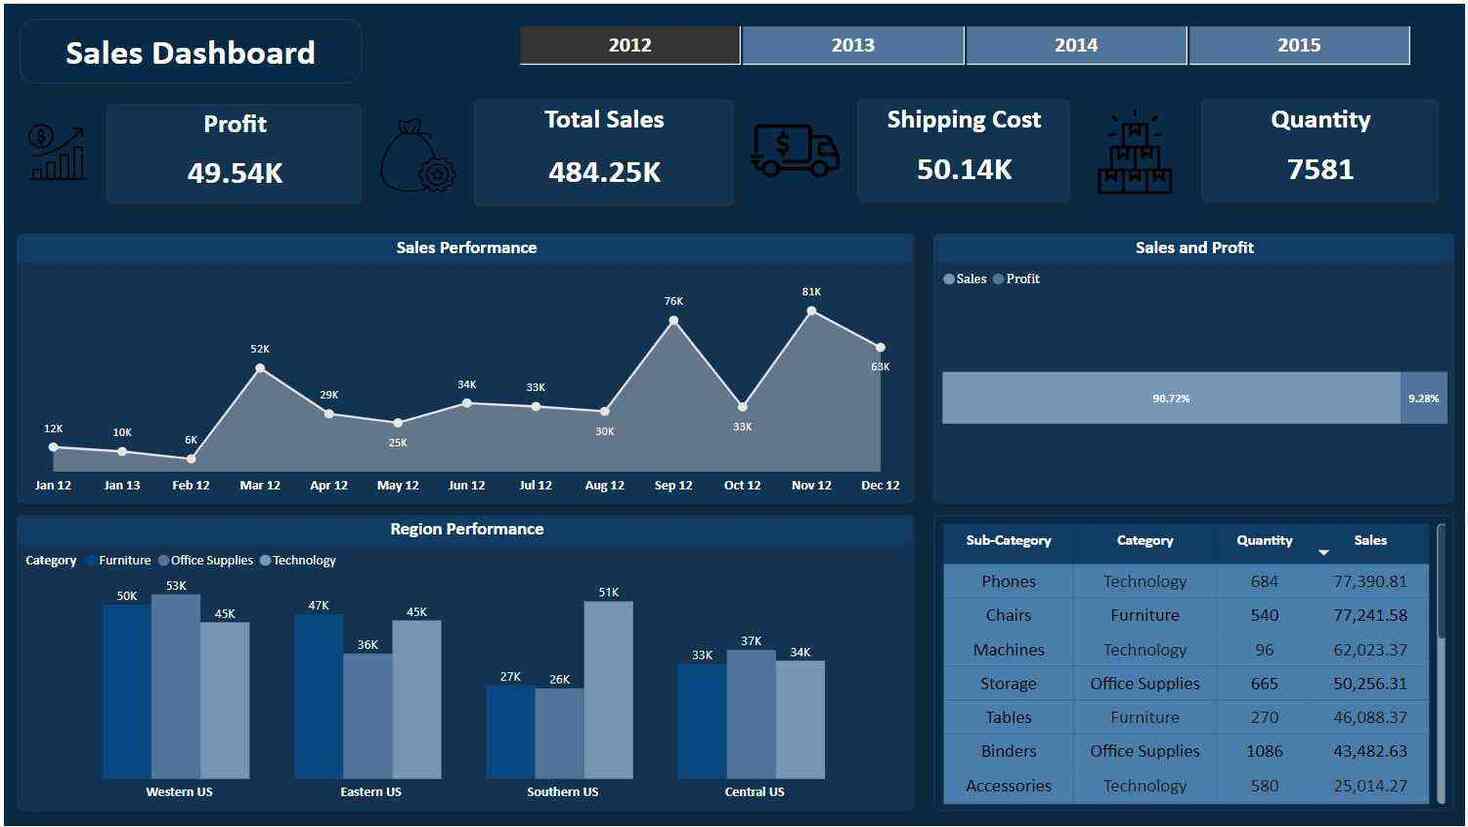
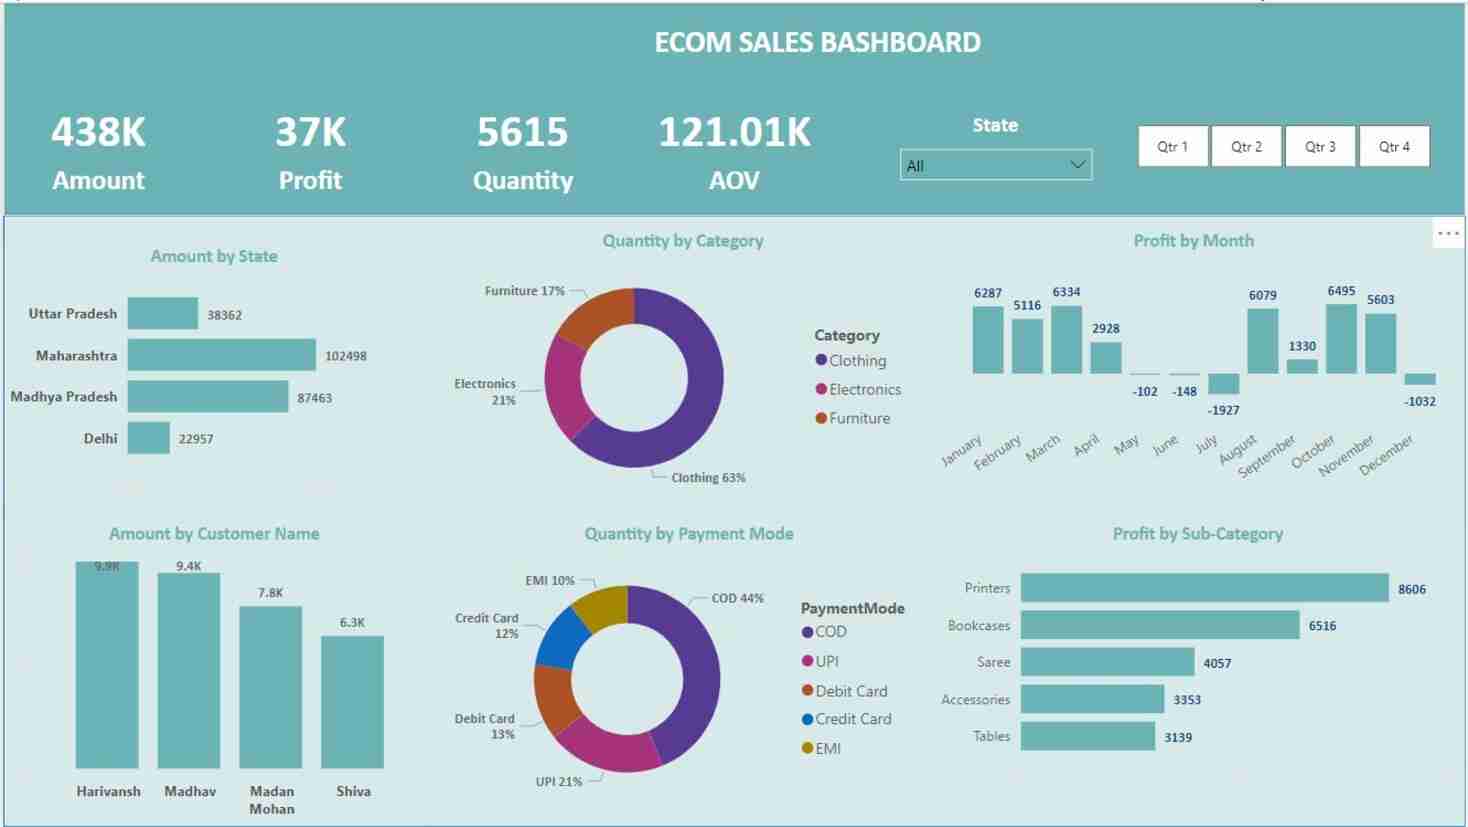
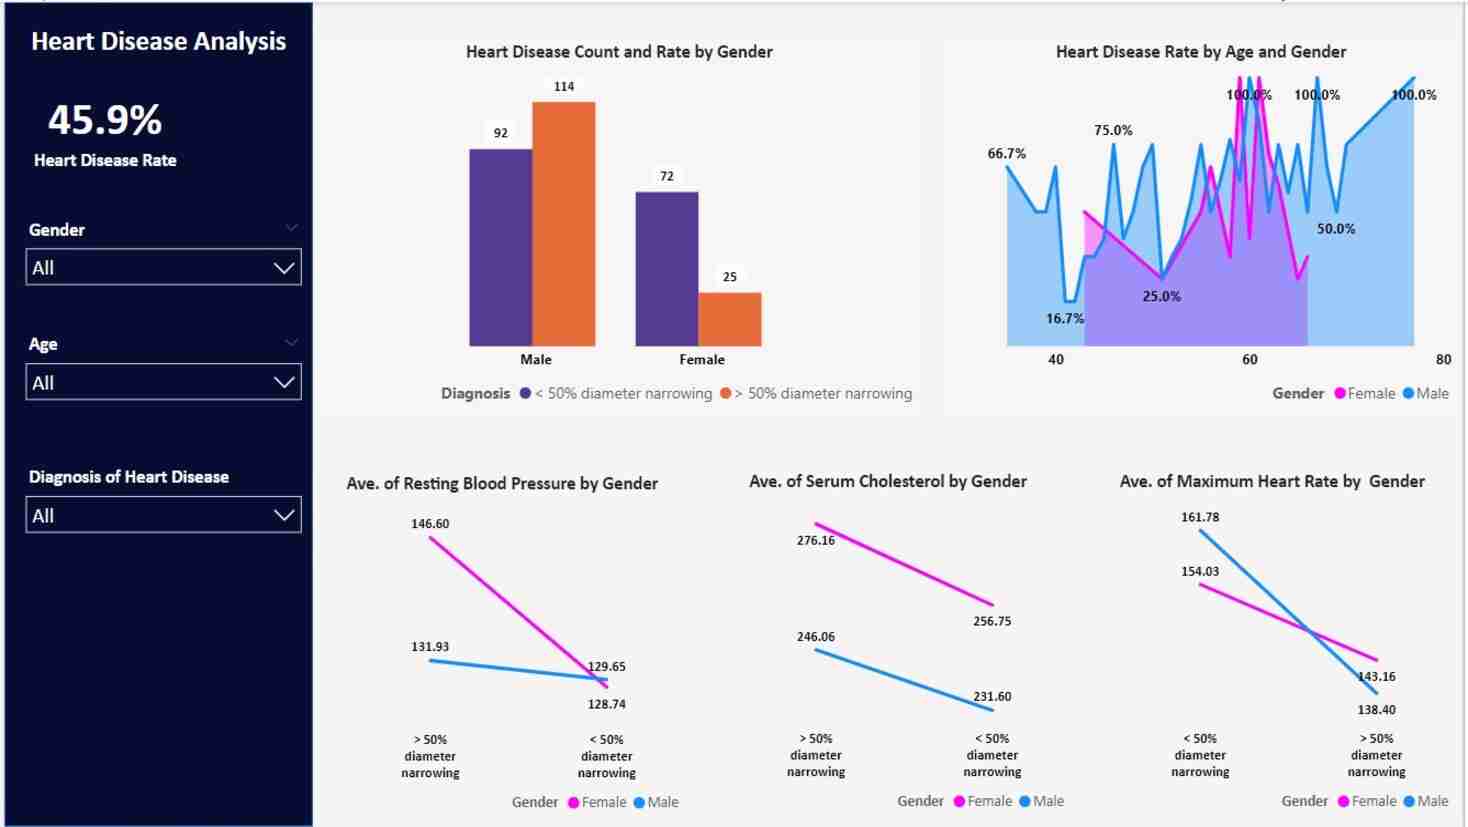
🟢 Power BI :- Data Cleaning, Data Modelling, DAX Calculations, DAX Studio, Tabular Editor, Visualization, Setting Security Levels, Deployment


Description of the SVG

🟢 DAX :- Calculated Columns and Measures, Time Intelligence Functions, Filter and Row Context, Optimization Techniques


Description of the SVG

🟢 Microsoft Fabric :- Delta Lake, Delta Table, Data Warehousing , Data Pipeline, One Security, Shared Workspace


Description of the SVG

🟢 SQL :- DDL, DML, DQL, Stored Procedures, Window Functions, Data Analysis, Extracting Reports


Description of the SVG

🟢 Power Automate :- Power Automate Desktop & Cloud Flow, Process Identification, Process Selection & Creating flow, Deployment, Testing & Support


Description of the SVG

🟢 MS Excel :- Logical Functions, Maths & Stats Functions, Look Up & Index Match Function, Pivot tables & charts, Macro


Description of the SVG

🟡 Azure Databricks :- Workspace, Notebooks, Managing Clusters and Jobs


Description of the SVG

🟡 Azure Data Factory :- Pipelines, Data Ingestion, Data Transformation, Data Movement and Workflow Orchestration


Description of the SVG

🟡 Storage Accounts :- ADLS, ABS, Real-time Processing, Integration with Azure Synapse Analytics


Description of the SVG

🟡 Python :- NumPy, Pandas, Matplotlib, Scikit-Learn, Scipy, TensorFlow, Keras, Data Analysis, Statistical Analysis, and Predictive Analysis


Description of the SVG Description of the SVG Description of the SVG Description of the SVG Description of the SVG Description of the SVG Description of the SVG Description of the SVG Description of the SVG Description of the SVG Description of the SVG Description of the SVG

Work Experience & Education

Professional Experience 💼

Power BI & Analytics Consultant

Mar 2024 - Present

Deloitte South Asia LLP, Bengaluru, IN 🟢

  • Developed and implemented the Net Revenue Management (NRM) Reports, enabling business teams to drive 8% profitable growth by analyzing KPI’s, identifying 23% white space opportunity, and optimizing brand pricing, PPA, promotions, and trade terms.
  • Created and maintained simplifies dashboards with SMART insights and KPI’s, providing clear, actionable insights that enhance decision-making processes and support strategic objectives across price tiers with less than 1% deviation across regions and channels.
  • Applied Agile methodology for sprint planning within 10% of the average sprint velocity, requirement gathering, dashboard development, and management of bugs and change requests (CRs) across UAT, QA, Dev, and Prod environments.
  • Created Power BI reports to analyze top FMCG client and competitor sales, which helped business users to identify growth opportunities, leading to informing strategic decisions and approximately 15% sales growth in some regions and channels.
  • Implementing rule-based smart insights for actionable recommendations, improving inventory management and investment strategies by highlighting average inventory trends and price fluctuations, resulting in 15% increase in inventory turnover.

Data Analyst

Oct 2021 - Mar 2024

Hinduja Global Solutions Ltd. Bengaluru, IN

  • Developed Power BI dashboards for workforce and financial analytics, leveraging linear regression for call volume forecasting, resulting in optimized resource allocation and a 35% reduction in manpower costs.
  • Automated real-time analytics processes by integrating Power Automate with SharePoint, resulting in a streamlined workflow that reduced data retrieval time by 70% and increased reporting accuracy for decision-making.
  • Implemented and automated comprehensive KPI dashboards in Power BI, integrating metrics like Bill to Pay, Attrition (less than 5-15% target range), and Occupancy (75-85% target range) for data-driven insights. Streamlining critical reports and KPI's such as Performance, Growth Rate, and Absenteeism (reduced by 15%)

Consultant

Nov 2018 - Jun 2019

Maruti Suzuki Arena, Bengaluru, IN

  • Created and shared updated Excel reports on lead generation and MTD sales conversion, consistently meeting monthly goals.
  • Conducted customer profiling and effective needs analysis for prospective clients, resulting in a 30% increase in sales.
  • Collaborated with clients on financing and leasing options, implementing internal financing strategies to achieve monthly goals.

Education 🎓

MBA In Analytics and Data Science

Jul 2023 - Jun 2025

Manipal University, IN

  • Developed analytical and technical skills in data science, statistics, and operations research for data-driven decision-making.
  • Enhanced leadership and strategic thinking through project management and organizational behavior studies.

Programme in Data Science and AI

Jul 2022 - Jul 2023

Indian Institute of Technology, Madras, IN

  • The design, development, and deployment of multiple machine learning projects, along with the creation of business intelligence dashboards.

Bachelor of Engineering

Jul 2014 - Jun 2018

MVJ College Of Engineering, VTU, Bengaluru, IN


Internship

Air India, Mumbai, IN

Jan 2018 - Feb 2018

  • Analyzed aircraft stability derivatives due to manufacturing deviations by gathering historical data and constructed the model.

Topmate.io

Let's connect to make impact!

Certifications 📜

Adv. Data Science and AI Certificate
IIT M : Jul 2022 - Aug 2023

Show credential

Machine Learning Models in Microsoft Azure
Coursera - Microsoft

Show credential

MS SQL Developer Certificate
Intellipaat Software pvt ltd

Show credential

Microsoft Azure Machine Learning for Data Scientists
Coursera - Microsoft

Show credential

Google Data Analytics Professional Certificate
Coursera - Google

Show credential

Power BI Virtual Case Experience
PwC - Forage

Show credential

MS Excel Statistics Essential Training
LinkedIn Learning

Show credential

MS Power Automate: Business Process Flows
LinkedIn Learning

Show credential

Awards 🏆

Corporate Value Award for Excellence
Hinduja Global Solutions Ltd.| Apr 2022 – Sep 2022

Show credential

Conference, Publicaitons & 14 Plus Extracurricular awards
IJETSR | ICAEASM | Edu institutes

Show credential

Corporate Value Award for Collaboration
Hinduja Global Solutions Ltd.| Oct 2022 – Mar 2023

Show credential

Innovation Challenge 2023
Hinduja Global Solutions Ltd. | Ideas for impact

Show credential

Projects (Outdated) ‍💼

"I invite you to go through my old projects in various domains using different tools, but currently I am working on advanced projects.
Hover and click the associated link icon to explore more about a particular project.

  • All
  • Power BI
  • Tableau
  • Python(ML)
  • SQL

Attrition Dashboard

Power BI,Excel,SQL

Sales & Marketing Performance Dashboard

Power BI,Excel,SQL

Sales & Budget Analysis Dashbaord

Power BI,Excel,SQL

CX Trend Analysis Dashboard

Power BI,Excel,SQL

US Marriage & Divorce Rates Statistical Analysis

Python, Statistics

Flight-Fare-Prediction ML Project

Python, ML, Statistics

Diamond_Price_Prediction ML Project

Python, ML, Statistics

Breast Cancer Prediction

Python, ML, Statistics

Heart Stroke Prediction

Python, ML, Statistics

House Price Prediction

Python, ML, Statistics

Medical Cost Prediction

Python, ML, Statistics

Titanic Survival Prediction

Python, ML, Statistics

Red Wine Quality Prediction

Python, ML, Statistics

Student Dropout Analysis ML Project

Python, ML, Statistics

Zomato EDA

Python, ML, Statistics

Superstore Sales Dashboard

Power BI,Excel,SQL

E-commerce Sales Dashboard

Power BI,Excel

Power BI Presenation

Power BI,Excel

Heart Disease Analysis

Power BI,Excel

Attrition Analysis - 2

Power BI,Excel

Ad Insights Dashboard

Power BI,Excel

Sales Insights dashboards

Power BI,Excel

Monthly Report

Power BI,Excel

SQL Project : Chicago Traffic Crashes

SQL

SQL Project : Aliens of America

SQL

SQL Project : Data Cleaning

SQL

SQL Project : OSHA Fatalities

SQL

SQL Project : Chicago Crime and Weather

SQL

SQL Project : Dictionary Challenge

SQL

Amazon | Disney | Netflix OTT Media Dashboard

Power BI,Excel

Get In Touch 📧

Let's work together!

Email :

sachinds360@gmail.com

Email Me

Call :

+91 7975629138

Call Me

LinkedIn :

linkedin.com/in/sachin-m

LinkedIn

GitHub :

github.com/Sachinsatya

GitHub

Location :

Bengaluru, IN

Location

Thank you for visiting!